Ocean Heat
The Global Ocean Monitoring and Observing Program conducts long-term ocean observations that help us better predict and prepare for the impacts of hotter seas, including rising coastlines, changing fisheries, coral bleaching, and more frequent storms.
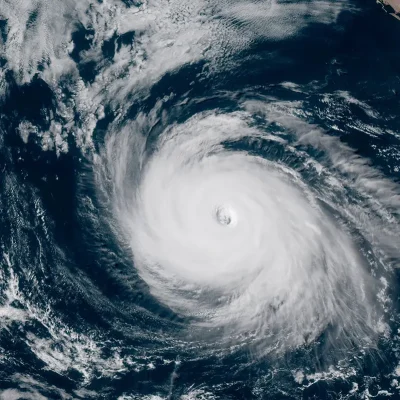
Visualization of global sea surface temperatures.
Image Credit: NOAA Climate Program Office
About the Program
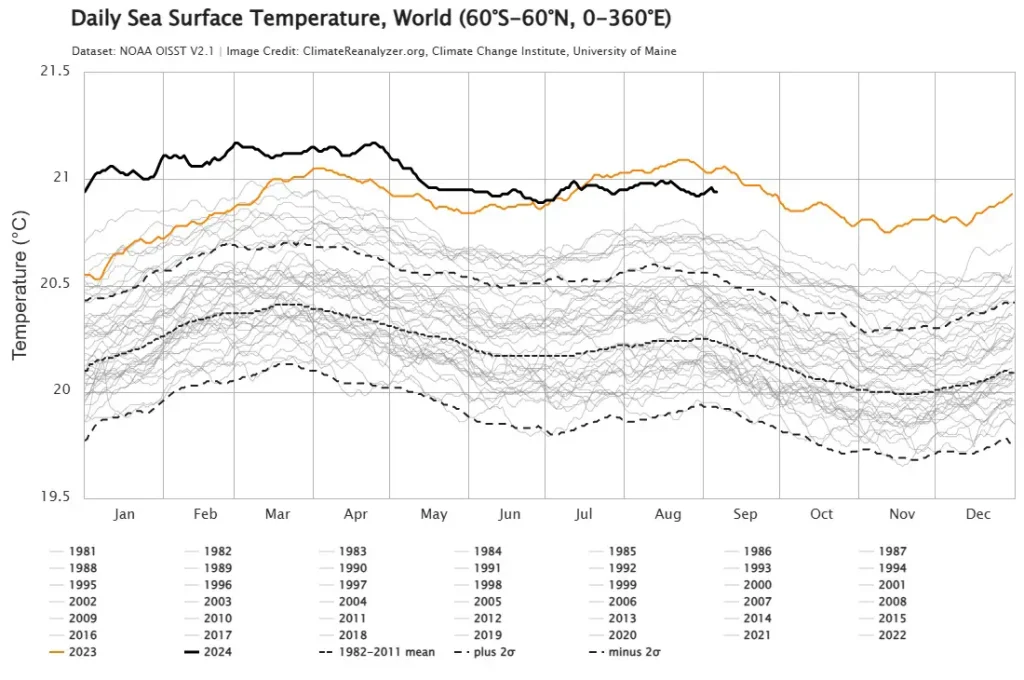
The global ocean is getting warmer.
NOAA is dedicated to understanding how much and how fast the ocean will warm, and what the ripple effects will be. Measuring changes in ocean conditions, producing datasets and tools that are accessible for a range of users, and improving model projections are a few ways that we are empowering leaders and communities across the globe to make informed marine management decisions.
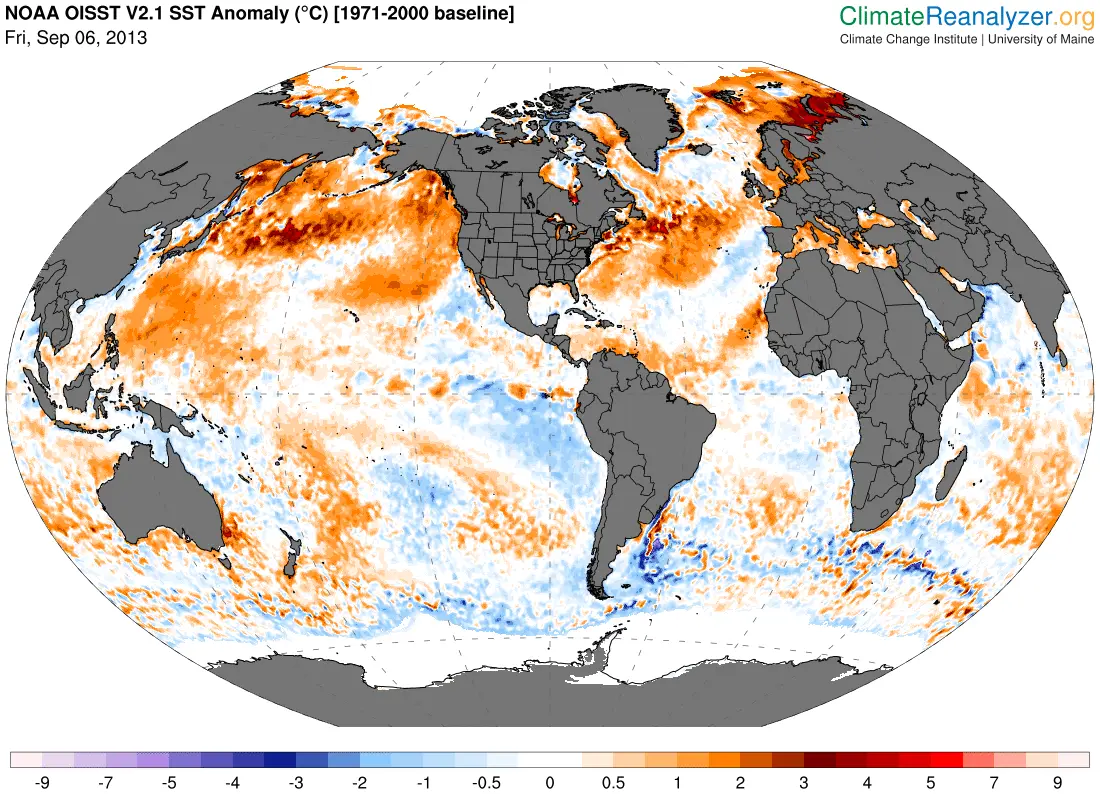
Image Credit: Climatereanalyzer.org, Climate Change Institute, University of Maine
What happens in the ocean doesn’t stay in the ocean.
Increasing ocean temperatures affect people on land, atmospheric processes, glaciers and ice sheets, and living organisms everywhere.

Ocean heat impacts our weather
The ocean and atmosphere exchange gases which affect things like how much heat or moisture the air can hold. This, in turn, influences weather across the globe. Warmer ocean waters are connected to changes in day-to-day weather, stronger storm events, like hurricanes, and influence longer-term climate events such as El Niño and La Niña.
With the frequency of billion-dollar weather and climate events increasing, understanding the role of ocean heat in future storm projections is critical to protect communities and infrastructure.
Ocean heat impacts our coastlines
Polar ice sheets may seem far away, but the response of these frozen masses to increasingly hotter ocean waters impacts us worldwide. As interactions between warming ocean waters and ice shelves (floating extensions of ice on land) drive increased rates of ice melt, more ice moves from land to the ocean and causes global sea level to rise. This sea level change impacts the nearly 40% of the US population that lives in a coastal county, where onshore infrastructure loss and nuisance flooding are increasingly of concern.
Melting glaciers and ice sheets are not the only contribution to sea level rise: as water molecules warm, they expand. This thermal expansion is another driver of sea level rise, and also plays a role in the frequency and severity of hurricanes and tropical storms.


Ocean heat impacts our ecosystems
From the surface to the seafloor, in the deep ocean and the coasts, marine organisms everywhere are impacted by warming ocean temperatures. Warming oceans are driving changes in the abundance of fish species, like Pacific salmon, while also impacting migration patterns of many different fish and mammal species, which coastal communities have relied on for generations. Shifting marine ecosystems in response to ocean heat not only affects economies (the US commercial seafood industry is worth >$6 billion), but also threatens cultural and spiritual ties to marine life as a means of subsistence.
Microscopic marine life is also responding to warmer waters, and this causes ripple effects up the food chain. Elevated ocean temperatures are linked to overproduction of different species of saltwater algae, some of which are toxic. These harmful algal bloom (HABs) events have been reported offshore every coastal state, and the frequency of HABs are on the rise in places like Alaska, introducing serious threats to human health and marine economies.
Excess heat is stored by the ocean.
As the concentration of gases like carbon dioxide and methane in Earth’s atmosphere continues to increase, predominantly as a result of human activities, so does the amount of solar energy (or heat) trapped by the Earth’s climate system. Much like a greenhouse, the amount of heat that enters into the atmosphere is greater than what escapes back out into space, leading to an overall increase in temperatures. The global ocean absorbs up to 91% of the excess solar energy that cannot be reflected back into space.
Climbing sea surface temperatures receive a lot of attention, but ocean heat does not only stay at the sea surface. Global ocean circulation slowly moves those warm water molecules from the surface to the deep ocean, where slow (but important) warming also takes place. While it takes about a thousand years to move a parcel of water through the entire ocean, this means that greenhouse forcing is reflected at all depths of the ocean, just on different timescales.
Why the Ocean?
It all comes down to two physical phenomena: albedo and specific heat capacity.
Have you ever chosen to wear a light-colored shirt in the summer instead of a dark one, knowing it would keep you cooler? Dark objects, like your dark t-shirts and the ocean, have a low albedo – meaning they retain more heat than they reflect. Not only does ocean water have a low albedo, but it also covers over 70% of our planet, making it a natural storage space for excess heat. Sea ice, or frozen ocean water, is a natural, highly reflective, high-albedo barrier against ocean heat absorption. However, the steady trend of decreasing Arctic sea-ice exposes more ocean water and creates a feedback loop of increased warming.
The ocean also requires significantly more energy (over 1000x more!) to warm by one degree Celsius compared to the atmosphere. You can see this phenomenon, called specific heat capacity, at work the next time you’re around a gas stove: when you put your hand above the flame, you feel the heat instantly because the air is warmed quickly. However, when you put on a pot of water to boil, the water takes some time before it warms up.
So, what does this all mean? Any measurable change of global ocean temperatures, even a fraction of a degree, represents the absorption of a substantial amount of energy over a relatively short amount of time.
Between 1993 and 2022, the amount of heat energy absorbed by the ocean was more than 800 times the total electricity consumed by the United States in just 2022 – the year with the highest energy use recorded.
How NOAA is monitoring and predicting impacts of ocean heat.
"The lack of long-term measurements of the global ocean and changes in the observing system over time makes documenting and understanding change in the oceans a difficult challenge."
-IPCC AR5

Measuring the pulse of the ocean
It’s hard to measure how something is changing with only a couple of data points. How can you tell what is “normal”? By maintaining networks of ocean observing systems in each ocean basin over multiple decades, we are checking the pulse for what is “normal,” and can detect when ocean conditions stray from that baseline.
The Global Ocean Monitoring and Observing program (GOMO) funds a variety of devices that measure ocean temperature, and other important ocean properties like salinity and carbon dioxide, in each of the planet’s ocean basins. These long-term and widespread observations allow us to measure changes in ocean heat and better predict future climate impacts.
Through GOMO, NOAA measures ocean heat using a variety of ocean observing instruments.
Learn more about these in situ, or in-the-ocean instruments by clicking below:
CTD Rosette
CTD rosettes are deployed from research vessels to measure Conductivity (salinity), Temperature, and Depth (CTD) and collect discrete water samples from the surface to the seafloor. The rosette is equipped with bottles to collect samples throughout the water column.
Argo Floats
Over three million profiles of ocean data have been collected by autonomous Argo floats. Since the program’s inception in 1999, Argo float design has advanced to measure the deep ocean (to 6,000m), and feature sensors that take biological and chemical measurements.
Surface Drifters
More than 1,300 satellite-tracked surface drifting buoys currently drift with ocean currents, collecting data on sea surface temperature, currents, atmospheric pressure, winds, waves, and salinity.
Gliders
Autonomous underwater ocean gliders typically operate for a few months per mission, collecting data on temperature, salinity, currents, and biological conditions.
Autonomous Surface Vehicles
Autonomous surface vehicles (e.g. Saildrones) sail across the ocean collecting data such as ocean heat and atmospheric and surface ocean CO2 measurements.
Moored Buoys
Buoys, like the ones in the OceanSITES network, are fixed to the seafloor and float at the ocean surface. They feature sensors and gauges that measure precipitation, wind conditions, and more!
Tide Gauges
Tide gauges around the world measure how sea level is rising, which is often a direct impact of ocean warming. Through the Global Sea Level Observing System, GOMO funds 50+ tide gauges across the world!
eXpendable BathyThermographs (XBTs)
Beginning in the 1960s, XBTs have been deployed from research vessels and Ships of Opportunity (SOOP) to collect temperature observations of the upper 1km of the global ocean. Currently approximately 10,000 XBTs are deployed annually.
We Support the Advancement of Ocean Science
GOMO provides support for institutions from around the country that foster advancements in understanding and protecting our global oceans. View the research projects that impact people, ecosystems, and the economy.


